
# AI Agent Observability: Monitoring, Logging, and Debugging Production Systems
In production environments, AI agents operate autonomously—making decisions, executing tools, and interacting with external systems without human intervention. When something goes wrong, the cost of failure can be significant: corrupted data, wasted API spend, missed business events, or degraded user experience. This is why observability is not a luxury for AI agents—it is a production requirement.
Observability in AI agents goes beyond traditional application monitoring. It requires tracking multi-step reasoning chains, capturing tool call outcomes, preserving conversation context, and correlating agent behavior with business KPIs. This guide covers practical frameworks, tools, and patterns for building observable AI agent systems you can trust in production.
## Why Observability Matters for AI Agents
Traditional software monitoring answers “Is the system healthy?” AI agent observability must answer “Is the agent making the right decisions, and why?”
Agents introduce unique challenges. A single user request can trigger dozens of tool calls across multiple APIs. Reasoning chains branch, loop, or backtrack. Context windows fill rapidly, causing earlier information to be forgotten. External dependencies fail unpredictably. Without proper observability, these failures remain invisible until they cause downstream damage.
The stakes are higher because agents act autonomously. A misconfigured search tool fetches incorrect data. A retry loop exhausts API rate limits. A poorly bounded agent enters an infinite decision cycle, burning tokens and inflating costs. Observability gives you the visibility needed to detect, diagnose, and prevent these failures before they impact users.
## Core Pillars of Agent Observability
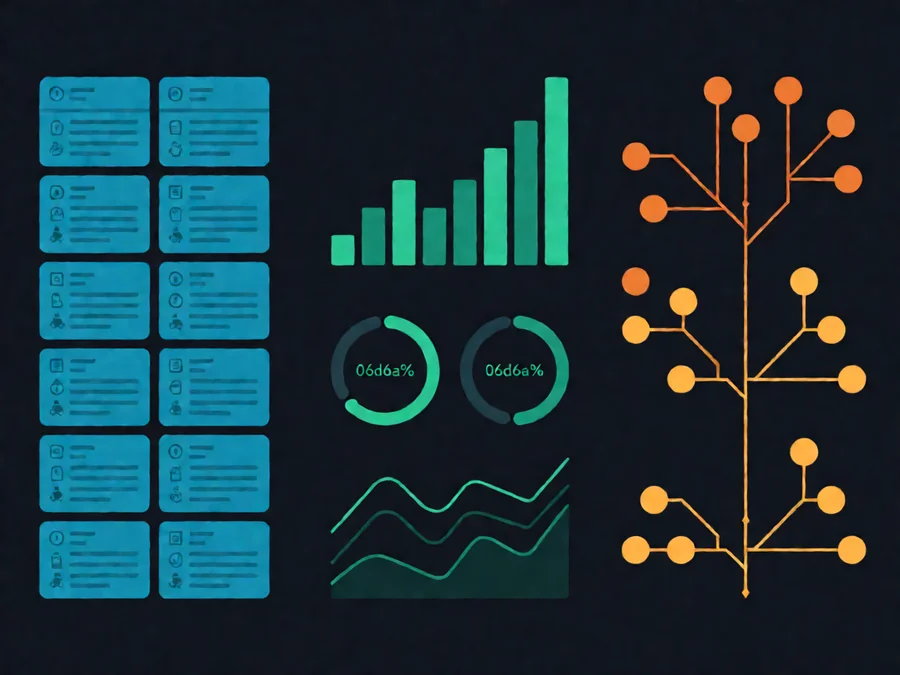
Effective agent observability rests on three pillars: logging, metrics, and traces.
### Structured Logging
Structured logs are the foundation of agent observability. Unlike plain text logs, structured logs encode machine-readable key-value pairs that can be queried, filtered, and aggregated at scale. For AI agents, every meaningful event should produce a structured log entry.
Critical logging events include agent initialization, tool call invocations with arguments and results, reasoning steps, context window status, error conditions, and completion signals. Each log entry should include a consistent schema: timestamp, agent identifier, session ID, tool name, input parameters, output, latency, and error codes when applicable.
Production logging should follow the LOG level hierarchy—DEBUG for detailed trace information, INFO for operational milestones, WARN for recoverable anomalies, ERROR for failures requiring attention, and CRITICAL for system-breaking issues.
### Metrics and Counters
Metrics provide quantitative signals about agent performance. Key metrics include token consumption rates, tool call success and failure rates, average and p99 latency per operation, context window utilization, agent loop iteration counts, and cost per request.
Rate-based metrics help detect anomalies. A sudden increase in tool call failures may indicate external API degradation. Unusual token consumption patterns can signal reasoning loops or excessive context buildup. Latency distributions reveal whether specific tool calls are causing performance bottlenecks.
Gauge metrics track state at a point in time. Context window fill percentage, active session count, and current agent memory usage provide immediate health signals. Threshold-based alerts on these gauges enable proactive intervention before resource exhaustion occurs.
### Distributed Tracing
Distributed traces connect individual operations across the agent lifecycle. Each user request generates a trace—a chronological sequence of spans representing tool calls, reasoning steps, and external API interactions. Traces reveal the execution path that led to a specific outcome, making them indispensable for debugging complex agent behavior.
Effective tracing requires unique trace IDs propagated across all tool calls and sub-agents. Each span should record entry and exit times, input and output summaries, error conditions, and child span relationships. Span attributes should encode tool names, API endpoints, model identifiers, and confidence scores.
## Practical Implementation Patterns
### Agent-Level Observability Wrappers
Observability should be integrated at the agent framework level rather than added ad hoc to individual tools. An observability wrapper intercepts every tool invocation, records structured logs, captures timing data, and emits metrics before returning control to the agent logic. This ensures consistent telemetry regardless of how tools are called.
Wrapper implementations should capture tool name, input arguments, output results, execution duration, and exception information. For reasoning-heavy agents, record model response metadata including token counts, stop reasons, and confidence indicators.
### Session-Based Context Tracking
AI agents operate within sessions—bounded collections of messages and state that persist across interactions. Session tracking correlates individual tool calls and reasoning steps into coherent conversation threads, essential for understanding agent behavior over time.
Session tracking should persist to a durable store indexed by session ID, user identifier, and timestamp. Each session record includes agent configuration, model parameters, tool inventory, and summary statistics about tool usage patterns.
### Tool Call Schema Validation
Observability improves when tool inputs and outputs conform to validated schemas. Schema validation catches malformed requests before they reach external APIs, reducing noise in error logs and improving signal quality in metrics. Implement schema validation at the observability wrapper level and record validation failures as distinct error events.
## Debugging Production Agent Failures
### Root Cause Analysis
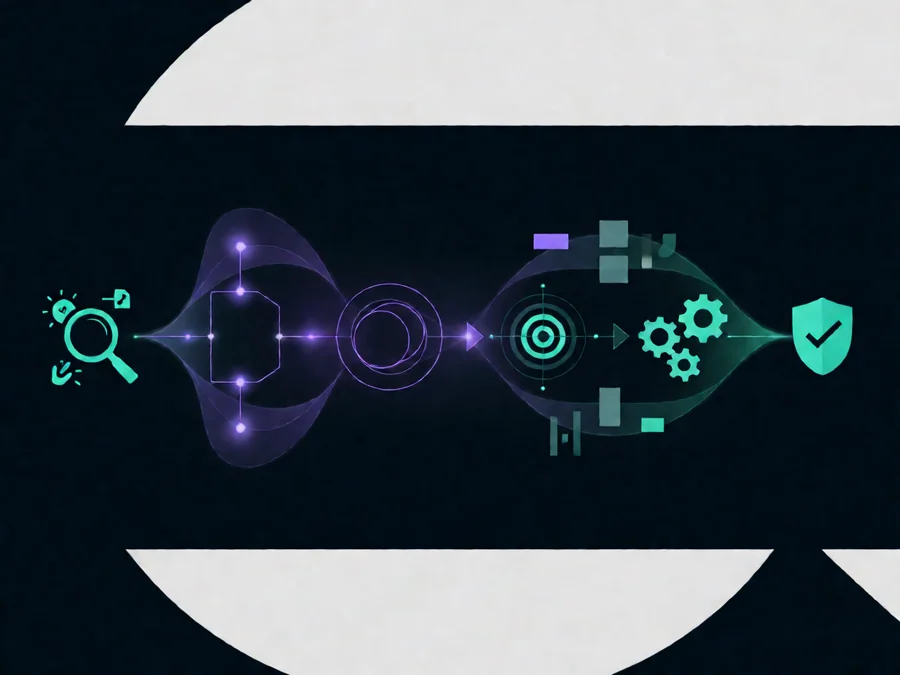
When an agent produces incorrect output, root cause analysis examines the trace for the failed request, focusing on tool call sequences, reasoning steps, and external API responses. Root causes typically fall into categories: environmental failures (external API failures, network timeouts), configuration errors (incorrect tool parameters, missing environment variables), reasoning flaws (agent misinterprets instructions), or data quality issues (malformed inputs, stale reference material).
### A/B Testing Agent Behaviors
Debugging agent failures often involves comparing successful and unsuccessful executions. A/B testing isolates variables that differentiate correct from incorrect outcomes. When an agent failure is detected, replay the exact same inputs with modified parameters and compare resulting traces. Document successful configurations and failure patterns in a knowledge base for future reference.
## Tools and Infrastructure for Agent Observability
| Tool Category | Recommended Tools | Use Case |
|————–|——————-|———-|
| Structured Logging | Datadog Logs, ELK Stack, Loki | Centralized log aggregation and querying |
| Metrics Collection | Prometheus, Datadog Metrics, TimescaleDB | Real-time metric dashboards and alerting |
| Distributed Tracing | LangSmith, Arize Phoenix, OpenTelemetry | End-to-end request flow visualization |
| Agent-Specific | agentops.ai, Langfuse, Weights & Biases | Purpose-built agent observability |
| Alerting | PagerDuty, Grafana Alertmanager, custom webhooks | Automated incident response |
Each tool category serves a distinct purpose. Structured logging handles high-volume event recording. Metrics collection powers real-time dashboards. Distributed tracing provides execution path visualization. Agent-specific tools offer features like conversation replay and reasoning trace analysis.
## Measuring Observability Effectiveness
Mean time to detection measures how quickly agent failures are identified. Effective observability reduces detection time from hours or days to minutes or seconds. Mean time to resolution measures how quickly identified failures are diagnosed and fixed.
Agent reliability metrics track the percentage of requests completed successfully without intervention. User experience metrics capture the end-user impact of agent failures. Faster detection and resolution should translate into fewer user-facing errors and higher satisfaction scores.
## Common Observability Pitfalls
### Over-Observability
Logging every tool call with full input and output payloads generates enormous data volumes. Storage costs escalate, query performance degrades, and signal gets buried in noise. Mitigate by sampling high-frequency tool calls, truncating large payloads, and aggregating routine events. Reserve full fidelity logging for error conditions.
### Inconsistent Instrumentation
When different team members instrument different parts of the agent system with varying schemas, observability becomes fragmented. Establish instrumentation standards early and enforce them through code review. Create shared libraries and wrapper functions that embed consistent observability patterns.
### Alert Fatigue
Excessive or poorly tuned alerts desensitize operators to genuine warnings. Tune alert thresholds based on actual failure patterns. Implement alert suppression and deduplication. Require explicit justification for each alert—what action should an operator take when it fires?
## Building an Observability-First Agent Strategy
Observability should be designed into agent systems from the beginning rather than added as an afterthought. Start by defining the operational questions your agent system must answer: what failure modes are acceptable, what performance targets define success, what user experiences must never degrade?
Establish observability review gates alongside functional review gates. Before deploying new agent capabilities, verify that required telemetry is present, alerting is configured, and dashboards reflect the new behavior. Treat observability gaps as deployment blockers, not nice-to-have enhancements.
Create feedback loops between operators and developers. When operators identify blind spots, developers prioritize instrumentation improvements. When developers discover unexpected failure modes through logging, operators refine alerting procedures.
## Frequently Asked Questions
**What is the minimum observability setup for a production AI agent?**
At minimum, implement structured logging for all tool calls with timestamps and latency, basic metrics for token consumption and failure rates, and distributed tracing for end-to-end request visibility. This foundation enables detection and basic diagnosis of most production issues.
**How much overhead does observability add to agent performance?**
Well-implemented observability adds typically 5-15 percent latency overhead through async telemetry submission and payload sampling. Optimize by batching telemetry, sampling high-frequency events, and using async submission pipelines.
**Should I log entire conversation histories?**
Full conversation history logging generates excessive data with limited operational value. Log conversation summaries, key decision points, and error conditions instead. Store complete histories only when required for compliance or debugging, with aggressive retention policies.
**How do I handle PII in agent observability?**
Implement PII detection and redaction at the instrumentation layer. Automatically redact email addresses, phone numbers, payment information, and other sensitive data before telemetry reaches storage systems. Apply consistent redaction rules across all logging paths.
**What is the relationship between observability and agent security?**
Observability provides the telemetry needed to detect security anomalies—unusual tool access patterns, unexpected API calls, or anomalous token consumption. Security controls protect the observability infrastructure from tampering. Implement both disciplines together for comprehensive agent protection.
## Conclusion
Observability transforms AI agent systems from black boxes into transparent, debuggable, and trustworthy production components. By implementing structured logging, comprehensive metrics, and distributed tracing, organizations gain the visibility needed to maintain agent reliability at scale.
The investment in observability infrastructure pays dividends through faster incident response, reduced operational costs, and improved agent reliability. As AI agents become increasingly autonomous and integral to business operations, observability transitions from a technical requirement to a strategic necessity.
Build your agent observability strategy now, before failures expose blind spots that could have been prevented with proper instrumentation and monitoring.
—
*This article is part of the SmaugBrain AI Agent operations guide. Explore our other resources on agent reliability, performance optimization, and production deployment patterns.*
[[cta href=”https://www.smaugbrain.com/”]]Explore SmaugBrain[/cta]